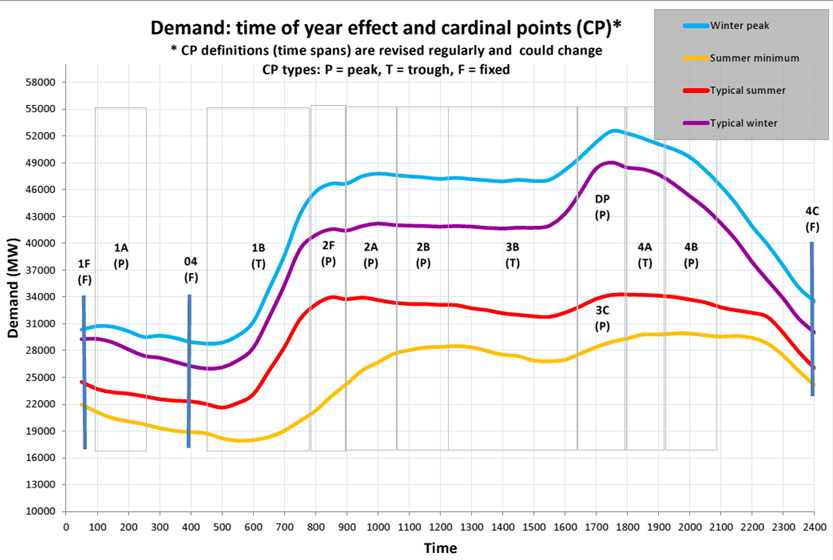
Demand Curve - Sample
The demand curve displays what time of the day the different cardinal points occur.
Additional Information
| Field | Value |
|---|---|
| Data last updated | December 12, 2019 |
| Metadata last updated | May 7, 2024 |
| Created | unknown |
| Format | PNG |
| License | ESO |
| Created | 5 years ago |
| Media type | image/png |
| Has views | True |
| Id | 2be09dad-2569-4fca-b4a9-92219e89c063 |
| Package id | 2b90a483-f59d-455b-be6d-3cb4c13a85d0 |
| Position | 1 |
| State | active |
